Introduction
A not too uncommon issue with larger projects (especially when utilizing multiple threads / for example: games) are freezes (or alternatively called: application hangs). From a user point of view these look like the app/game is not responding at all and just hangs.
As of Windows Vista a new functionality was added. The so called: “Window Ghosting”. [1] Without going into too much detail, this feature basically detects if an application responds within 5 seconds to the Windows message queue and if it doesn’t, marks the application as “not responding” and eventually provides a popup to the user allowing him to terminate the application. This “potential” freeze will then be uploaded to the Windows Error Reporting facility, where registered developers can access the details about the freeze conditions.
The caveat here is that your company might not want to invest the time/cost associated to get access to this data or might have intentionally disabled the Window Ghosting functionality, because it would cause issues with your particular application.
Retrieving user provided dumps
An alternative to the Windows Error Reporting facility is to ask users to provide you with two successive dumps at the time they experience the freeze/hang.
The idea is that you can then simply review the callstacks in the two dumps and directly see if a particular thread hangs inside a loop or might have run into a deadlock condition.
Retrieving two dumps is important, since a single dump just represents the current state of the app but doesn’t necessary proof that the dump shows a freeze/hang condition (i.e. the application might just be utterly slow in what it’s doing atm and you might misinterpret the current dump-state as a freeze). A second dump however provides you with the means to compare the two application states which usually should point you directly to a freeze or alternatively proofs that the app did not run into a freeze at all (in which case you might be looking at a performance bottleneck of the app which would have to be tackled to resolve the issue at hand).
Luckily starting with Windows Vista it became much easier for users to provide dump files for developers. [2] While before Windows Vista, users had to install additional tools (like ProcDump) which for a non-developer are not too intuitive to use, ever since Windows Vista the functionality to create dump files got directly built in into the task manager.
Creating dump files using the task manager
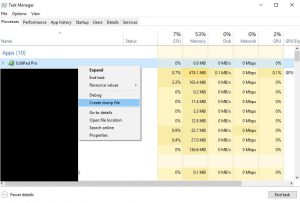
To create a dump file on Windows Vista or later, open the Task Manager (f.e. by right clicking the task bar and selecting: “Task Manager”), locate the unresponsive application in the list, right click the entry and select: “Create dump file”.
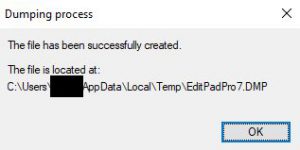
A popup will appear stating that the dump is being generated. Especially for larger applications like games, this can take up to several minutes. Eventually the dump will have been generated and another popup appears stating the location the dump was generated at:
 As the user you should then wait a couple of seconds and repeat that step. Afterwards you can provide the developer/support with the two dump files so they can work out what caused the application/game to freeze/hang.
Be aware however, that these files are rather large in size. It’s not uncommon for these to be several GB large. Fortunately they can be compressed quite good (compression factors of 10-100 are not uncommon to achieve).
A word on privacy
Please be aware that these dump files are basically full dumps of the application state including the entire memory section the application uses (that’s the main reason for why the dump file is so large), all the modules currently loaded on your machine, and additional system details which might contain personalized information.
Since the dump contains the entire memory footprint the application has access to, it will also contain any personal data (even potentially unencrypted passwords) the application might have stored. Even if the application doesn’t store passwords/personal data itself, the dump might still contain personal information and passwords which other applications missed to properly cleanup before freeing the memory section (i.e. if another application is suffering a security issue). So be careful whom and how you send these dumps to.
References
[1] = https://blogs.technet.microsoft.com/askperf/2010/09/10/de-ghosting-your-windows/
[2] = https://blogs.msdn.microsoft.com/debugger/2009/12/30/what-is-a-dump-and-how-do-i-create-one/
