Introduction
When working with the STL you certainly are using iterators at one point or another. One of the common mishaps when working with iterators is to run into undefined behavior if the iterator is or becomes invalid. This can not only happen due to obvious reasons (like missing to initialize an iterator) but also when performing certain container operations.
Undefined behavior due to iterator invalidation
Take a look at the following code sample:
|
1 2 3 4 5 6 7 8 9 10 11 12 13 14 15 16 17 18 19 20 21 22 23 24 25 26 27 28 29 30 31 32 33 34 35 36 37 38 39 |
#include <vector> #include <iostream> namespace Foo { class Bar { private: int m_id; public: Bar(int id) : m_id(id) { } void Print() const { std::cout << "My id: " << m_id << std::endl; } }; } int main(int argv, char* argc) { std::vector<Foo::Bar*> myElements; myElements.push_back(new Foo::Bar(1)); myElements.push_back(new Foo::Bar(2)); myElements.push_back(new Foo::Bar(3)); myElements.push_back(new Foo::Bar(4)); for (auto item : myElements) { item->Print(); myElements.push_back(new Foo::Bar(5)); myElements.push_back(new Foo::Bar(6)); } return 0; } |
We define a simple class which stores an id and provide a Print()-function which outputs the id to the console.
We then construct 4 elements of these classes and add them (as pointers) to the vector.
Finally we loop over the elements, output the current item, and add two more elements in there.
If you run the code in release configuration, it might produce the output you more or less expected/intended, produce some garbled output, or might crash.
Doing a couple of successive test runs using VS 2015 Update 3, the following output was produced:
|
1 2 3 4 |
My ID: 1 My ID: 2 My ID: 3 My ID: 4 |
In another run the same application triggered this output however:
|
1 2 3 4 |
My ID: 1 My ID: 827440 My ID: 3 My ID: 4 |
The issue in the code is most likely quite obvious to everybody. Inside the for-loop we push additional elements onto the vector. Vector iterators are invalidated however, if a reallocation occurs. [1]
So the result due to adding the vector::push_back() calls inside the for-loop is us causing undefined behavior. Bare in mind that while it’s an obvious issue in this tiny code sample, it can be a really hard to trace down these kind of issues in real world applications especially if these are hugely complex and/or lacking a proper system design.
One of the more nasty results these bugs can cause are memory corruptions which can be a headache to resolve especially if the conditions are strongly impacted by the exact runtime conditions between multiple threads which can make them close to impossible to trigger reliably (and even if they trigger, it’s not guaranteed that they cause a memory corruption in all runs as presented above already – that’s the nature of the behavior being undefined).
_ITERATOR_DEBUG_LEVEL comes to help
Fortunately, the developer is not left alone to trace down these issues. Visual Studio provides built-in checks in its STL implementation which detect such issues and trigger assertions/runtime exceptions if an issue is detected.
When you run the sample code above in debug configuration, you’ll get the following assertion:
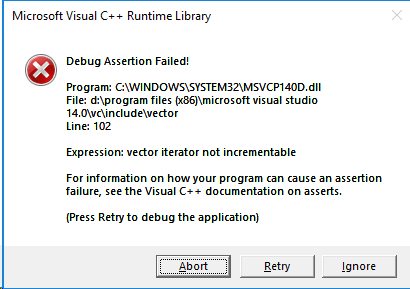
The debugger will directly point you to the fact that using the ++-operator on the iterator triggered the assertion as the iterator became invalid after the previous push_back() call.
These detailed checks are part of Visual Studio’s Debug Iterator Support [2] which contain quite a bunch of checks to ensure proper/valid usage of STL iterators.
These checks are obviously not free and degrade performance and increase the memory footprint of an application. Therefore, these checks are disabled in the release configuration by default and only enabled in debug configuration.
Different levels for _ITERATOR_DEBUG_LEVEL
The checks come in two flavors: level 1 (aka: Checked Iterators) and level 2 (aka: Debug Iterator Support) checks.
While level 1 checks perform certain cheap checks on iterators which ensures that out of bound access is detected [3] (as it is the case in the sample code above), level 2 checks perform additional more costly checks and therefore can detect other type of programming mishaps.
The level can be set using the _ITERATOR_DEBUG_LEVEL macro. However, level 2 checks require the use of the debug versions of the Microsoft Visual Studio runtime (i.e. /MDd or /MTd) and therefore are practically limited to the debug configuration.
Level 1 checks on the other side are also supported in release builds and if we add
|
1 2 |
#define _ITERATOR_DEBUG_LEVEL 1 [...] |
as the first line in the sample code above and run the program in release configuration we get the invalid parameter handler exception:
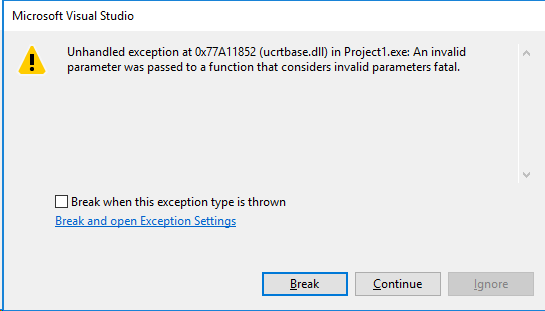
This makes it straight forward to detect such issues and prevents situations where you are spending days or even weeks tracing down memory corruption which are caused by such bugs.
Enabling iterator debug level can therefore be a real time safer.
Caveats of the _ITERATOR_DEBUG_LEVEL
The challenge to use the iterator checks is to enable the feature. While it’s enabled by default in debug configuration and therefore will basically work out of the box, debug configurations are not always something you can use in larger projects (f.e. in games). It also won’t cover situations where the conditions triggering iterator invalidation only occur in the release configuration (f.e. since the conditions are related to certain optimizations which change the runtime behavior of the program or when certain debug checks set up in the debug configurations are skipped).
You therefore might require to enable it in release builds – but this can imply a certain work overhead when 3rd-party libraries have to be taken into account.
The _ITERATOR_DEBUG_LEVEL setting must be set to the same value throughout all libraries linked with the program. Since the default setting for this is to have it disabled in release configurations this means that one has to (re-)build all 3rd-party libraries by himself and enable the setting for all libraries.
Fortunately, it’s mostly a thing of the past not being able to get access to 3rd-party source code when licensing libraries/frameworks/SDKs. So technically this should be doable. Depending on the project, this however can still be quite an undertaking.
If you happen to work on such a project where using the debug configuration for your daily work is unfeasible due to performance limitations, you might wanna consider introducing a third project configuration which corresponds to your release configuration PLUS the addition of enabled iterator checks. There might be other settings worth changing for such a configuration too (f.e. disabling the whole program optimization to safe time in building your project for the daily work but still keep it close to the released version) and a separate “developer release” configuration will also enable you to add code only used for development while leaving it out of the shipped versions.
A historical side note
Checked iterators is nothing which was recently introduced and has been around in Visual Studio for over a decade. In versions prior to Visual Studio 2010 it was however using two other macros:
- _SECURE_SCL
- _HAS_ITERATOR_DEBUGGING
These have been deprecated in favor of the new _ITERATOR_DEBUG_LEVEL macro and should be replaced with that one.
Also if you previously tried out the iterator debugging functionality you might have deemed it unsuitable for your needs. Earlier versions of Visual Studio suffered certain bugs triggering false positive assertions and especially at the beginning the implementation wasn’t too performant. Microsoft has worked on these downsides over the past [4] and especially the level 1 setting has a very low performance overhead in the experience of the author so you might wanna give it another try.
Conclusion
Iterator checks can be a real time safer for the daily work. Especially in larger projects with multi threading and different developers of varying experience level its advantages can easily rectify the required effort of enabling it in the project.
Bare in mind that even if you are lucky and never do the mistake of writing code causing invalid iterator use, having enabled iterator checks can still safe you time, because when investigating certain issues (like memory corruptions) you can be quite certain that the cause of these sometimes really hard to trace down bugs are unlikely iterators which became invalid. Therefore, you can rather focus your effort on other potential root causes and should be able to trace down the issue much faster.
References
[1] = C++11 standard / Working Draft N3242 – 23.3.6.5.1 “Remarks: Causes reallocation if the new size is greater than the old capacity […]” / 23.3.6.3.5 “Remarks: Reallocation invalidates all the references, pointers, and iterators referring to the elements in the sequence. […]”
[2] = https://docs.microsoft.com/en-us/cpp/standard-library/debug-iterator-support?view=vs-2017
[3] = https://docs.microsoft.com/en-us/cpp/standard-library/checked-iterators?view=vs-2017
[4] = https://devblogs.microsoft.com/cppblog/c1114-stl-features-fixes-and-breaking-changes-in-vs-2013/